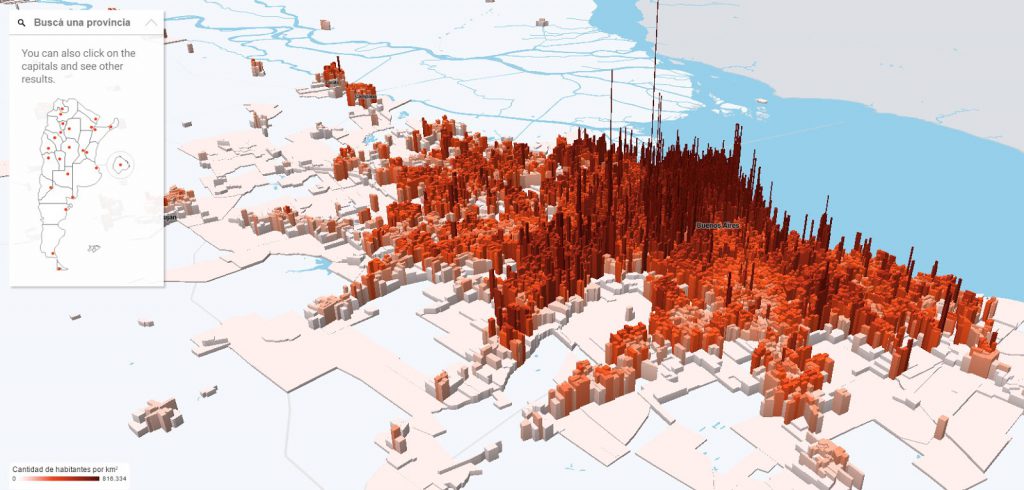
Information Graphics

Infographics have the power to present complex data in a concise, highly visual way. They tell data stories effectively by making information easy to digest, educational, and engaging. Infographics have been commonly used in presenting scientific research including quantitative urban analytic areas. In this tutorial, you will learn the basic skills of creating infographics, including the introduction on types and their application in urban research, different sources/platforms for easily making infographics. Also, this tutorial will show how to make a radar chart via Echarts as an example.